
Estimated reading time: 5 minutes
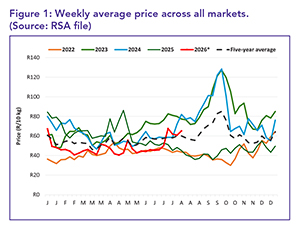
The average weekly price of potatoes during the first 31 weeks of 2026 at South Africa’s fresh produce markets (FPMs) showed a week-on-week increase of 7%. Figure 1, which tracks the weekly average price across all markets, potato classes, and sizes, indicates that the average price in week 31 stood at R65.16 per 10 kg bag. This represents a year-on-year increase of R20.04 compared to the corresponding week in 2025, underscoring heightened price volatility and market fluctuations.
Stock levels and price trends
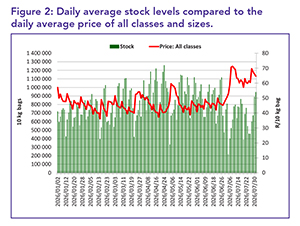
Figure 2 illustrates the relationship between supply and demand by analysing daily average stock levels alongside price trends. Elevated stock levels typically exert downward pressure on prices. The average daily stock across South African FPMs was 657 716 bags (10 kg) in July 2026, representing a 29% year-on-year decrease from the July 2025 average of 924 653 bags (10 kg).
Sales volumes and trends
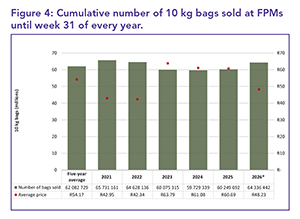
Figure 3 presents a year-on-year comparison of monthly sales volumes, showing a 11.97% increase in July 2026 relative to July 2025. Cumulative sales for the first 31 weeks of 2026 totalled 64.3 million 10 kg bags, which is 2 253 713 bags above the five-year average, as shown in Figure 4. Notably, the average price for the first 31 weeks of 2026 is R5.94 lower than the five-year average.
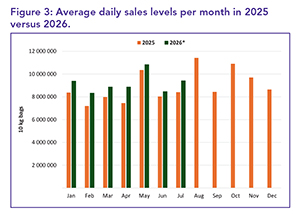
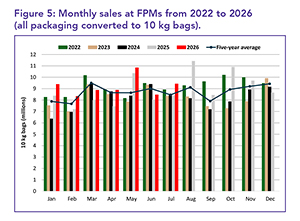
Monthly sales trends at FPMs, depicted in Figure 5, show a month-on-month increase, with July 2026 recording 9.4 million 10 kg bags sold, compared to 8.4 million bags in June 2026. This represents an increase in volume of 954 420 bags (10 kg).
Bag sales and averages
Table 1 outlines the number of bags sold at the various FPMs during July of 2026. The five biggest markets during this period accounted for 82.7% of the country’s sales, underscoring their pivotal role in the potato supply chain. The average price per 10 kg bag for July, across all classes and sizes, is also shown in Table 1, standing at R60.68.
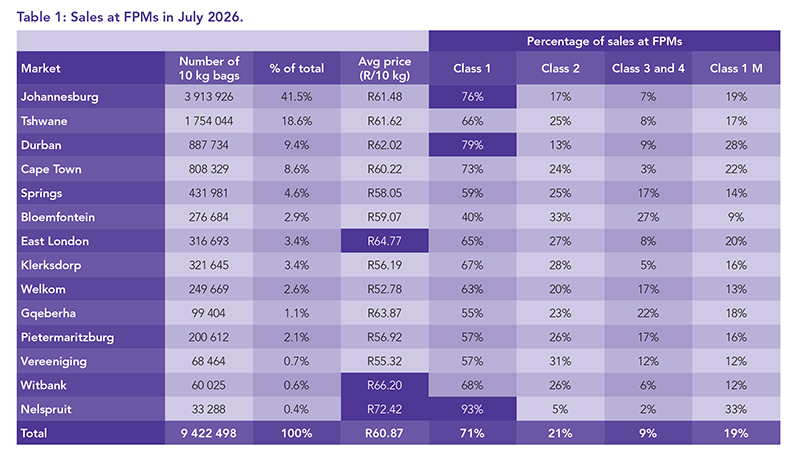
Regarding the top average price per 10 kg bag received at the markets during July, Nelspruit Market led with R72.42, followed by Witbank Market at R66.20 and East London Market at R64.77. In terms of Class 1 (all sizes) sales, the Nelspruit, Durban, and Johannesburg Markets recorded the highest distribution at 93, 79, and 76%, respectively. Among the top three markets, Durban ranked the highest.
Figure 6 illustrates the year-on-year price change at the top five markets for July 2026, with four of the five markets showing increases. Johannesburg Market showed the largest percentage increase, at 29.2%, compared to July 2025. Cape Town Market price showed the largest percentage decline at 2.5%.
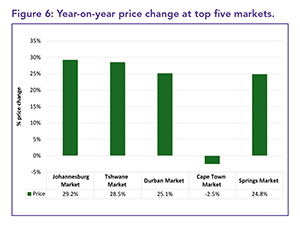
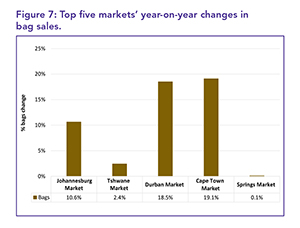
Figure 7 highlights the year-on-year percentage change in sales volumes for the top five markets, with Cape Town Market showing the largest increase at 19.1%.
Regional performance
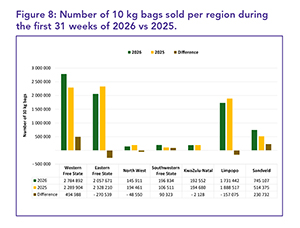
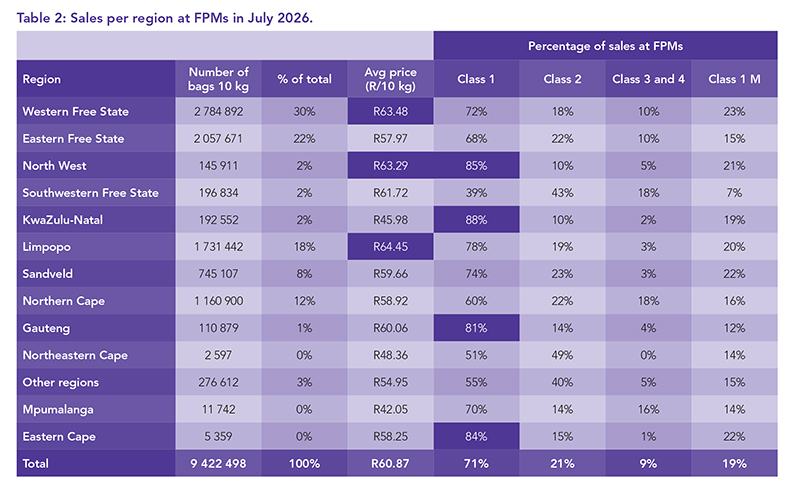
Figure 8 illustrates regional sales performance, with the Western Free State recording the highest volumes of 2.7 million 10 kg bags, reaffirming its position as the market leader in July 2026. This region recorded a year-on-year volume growth of 22%, while the Eastern Free State and Limpopo regions recorded decreases of 12 and 8%, respectively. The Western Free State, Eastern Free State, Limpopo, and the Northern Cape collectively accounted for 82% of total national potato sales in July 2026, as summarised in Table 2.
Potato classification also varies by region, as shown in Table 2. Regions such as KwaZulu-Natal, North West, and the Eastern Cape led in Class 1 sales, with 88, 85, and 84% of their sales falling into this premium category, respectively. Overall, eight of the 14 regions in the market maintained a Class 1 sales ratio above 70%, indicating variability in quality across some regions. – Lebo Tlomatsana and Jodie Hattingh, Potatoes SA
For more information, email Lebo Tlomatsana at lebo@potatoes.co.za