Estimated reading time: 17 minutes
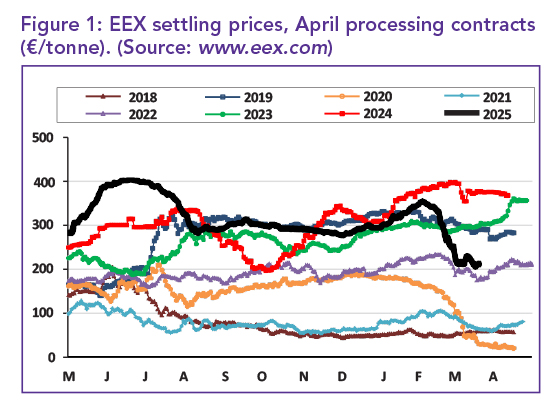
The past five years have been exceptionally volatile. In 2020, the world grappled with a historic pandemic, forcing drastic lifestyle changes. While fresh potato demand surged as people cooked at home, the processed potato market collapsed – only to rebound with record sales by 2023 (Figure 1). However, Covid-19 was just the beginning.
Brexit’s impact was expected, but prolonged conflicts in Ukraine and Gaza further disrupted food supply chains and drove up production costs. More recently, trade war threats have added to the uncertainty. Amid these crises, climate change looms large with new global temperatures recorded in 2020, 2023, and last year. Whatever the future holds, its impact on agriculture is undeniable.
UK fry imports decline
Consumer demand for fries in the United Kingdom (UK) remained sluggish in January, leading to a 4.3% year-on-year drop in imports to 68 042 tonnes – 1 000 tonnes lower than in December (Figure 2).
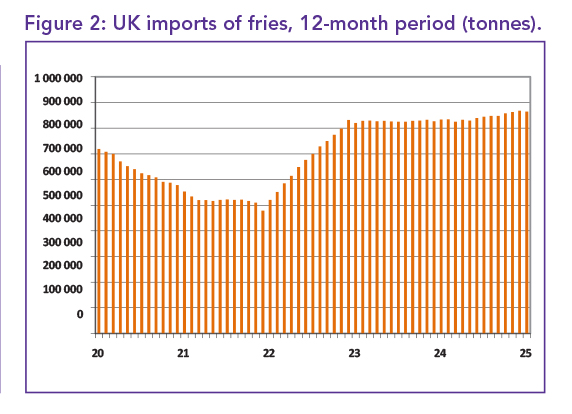
Lower prices brought the total import cost down by 6.3% from last year to £85.82 million (US$111 m; €102 m) this year.
Dutch fry prices rose by £11 to £1 254/t (US$1 627/t; €1 492/t), yet sales increased by 1 336 to 21 335 tonnes. Belgium’s fries remained slightly cheaper at £1 248/t (US$1 619/t; €1 485/t), though sales fell by 1 373 tonnes from December to 41 941 tonnes – still 4,5% higher than last year. Belgium now holds 58% of the UK fry import market, with annual sales up 10%.
German fries defied the price trend, rising 7.9% year-on-year to £1 686/t (US$2 187/t; €2 006/t), but sales dropped 11,7% to 1 409 tonnes. Meanwhile, Danish fry imports surged, with January sales up 12.3% to 119 tonnes, bringing annual sales to 1 491 tonnes – an 83.6% increase.
Danish fries were also 11.8% cheaper at £1 221/t (US$1 584/t; €1 453/t). Northern Ireland’s European Union (EU) fry imports, classified as “Unidentified” in UK records, held steady at £1 125/t (US$1 460/t; €1 339/t). However, volumes dropped 11.7% to 2 226 tonnes in January, with total EU imports down 3.1% over 12 months to 30 378 tonnes.
Favourable UK potato exports
UK processed potato exports saw their strongest January since 2020, reaching 2 708 tonnes – just below the 3 088 tonnes sold five years ago. The Irish Republic remained the top buyer, purchasing 2 229 tonnes, a 19.8% year-on-year increase. Prices rose by £4 to £1 107/t (US$1 436/t; €1 317/t), still 5.5% lower than last year.
The United States (US) was the second-largest market, buying 163 tonnes at £1 787/t (US$2 318/t; €2 127/t), marking its first UK purchase since June last year. The Netherlands bought 102 tonnes at £1 142/t (US$1 482/t; €1 359/t), 16.5% cheaper than a year ago. Belgium, by contrast, paid a premium of £3 588/t (US$4 653/t; €4 270/t) but only bought six tonnes. Other buyers included Hong Kong, Australia, France (28 tonnes each), and Malta (32 tonnes).
Australia’s price of £2 729/t (US$3 541/t; €3 248/t) was 3.2% lower than last year. The Democratic Republic of Congo purchased 18 tonnes at £1 389/t (US$1 802/t; €1 653/t), while Equatorial Guinea bought 16 tonnes at a higher £1 801/t (US$2 337/t; €2 143/t).
Strong ware potato trade
UK fresh potato (ware) exports reached 11 654 tonnes in January, a 15.8% increase from last year despite a 7 660-tonne drop from December.
The trade was worth £6.77 million, up 12.4%, though the average price fell 2.9% to £581/t. Over seven months, exports rose 27.1% to 100 722 tonnes, though still 10 000 tonnes lower than the same period in 2022/23.
Spain has overtaken Ireland as the UK’s top ware export market, with sales up 40.4% to 42 686 tonnes over seven months and 52.5% higher in January. Meanwhile, Irish shipments fell 8.8% to 32 085 tonnes, with January trade down 23%. Other markets remained below 10 000 tonnes but saw major growth – France increased over 200%, while Denmark and Belgium surged 300%.
Ware potato imports nearly doubled in January to 8 059 tonnes, with a seven-month total of 56 382 tonnes – 91% higher than last year. The average price dropped 25.5% to £446/t. Most imports came from “Unidentified” sources such as Northern Ireland, which follows the EU’s trade rules. Though volumes remain small, some sources saw massive increases with Israel’s imports skyrocketing by 658%.
Exports hit post-Brexit high
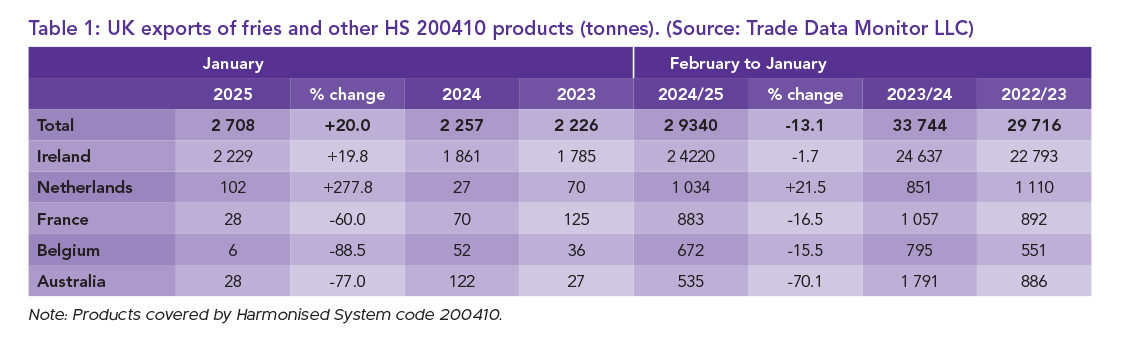
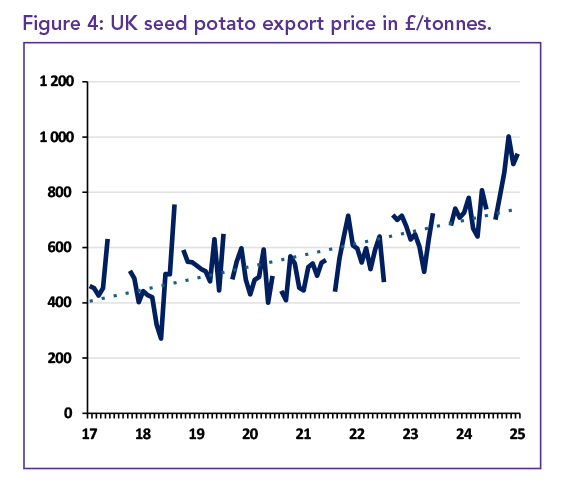
UK seed potato exports are set to surpass 100 000 tonnes for the first time since Brexit rules changed in 2021. With prices up nearly a third this season, the trade has generated record earnings – almost £90 million in the first seven months and nearing £100 million over the past year. January exports surged 40.3% year-on-year to 7 349 tonnes, with Morocco leading purchases at over 5 000 tonnes – twice its volume last year.
Egypt remains the top buyer, taking 60 858 tonnes in seven months, an 18.4% increase. Spain is the only EU country in the UK’s top ten seed markets, but trade is limited to the Canary Islands due to EU regulations, with sales there down 15.4%. Broader EU exports remain blocked due to regulatory misalignment.
Seed imports on the rise
The UK allows some direct EU seed potato imports, which have surged 155.8% to 5 897 tonnes in seven months, with January alone up 50.2% to 2 847 tonnes. The Netherlands dominates supply. The average import price in January was £904/t, £46/t lower than the export price (Figures 3 and 4).
France: Potato exports slow down
French fresh potato exports remained strong in January, reaching 310 485 tonnes – 13.9% higher than a year ago and the highest monthly total since April last year (Figure 5). Over seven months, exports rose 12.7% to 1 539 million tonnes, with sales valued at €519,6 million, up 9.4% despite a 7.9% drop in average prices (€339/tonne).
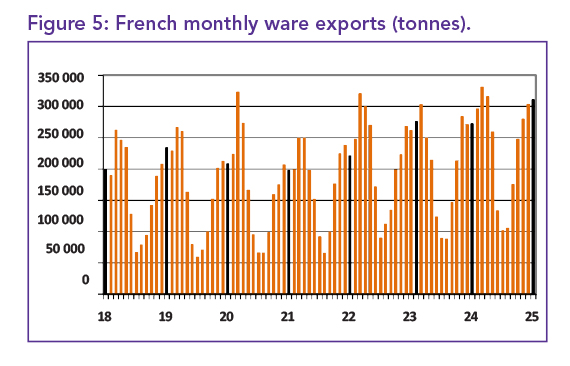
Growth was driven by Spain (+18.7%), the Netherlands and Germany (both over +40%), and Portugal (+29.5%). Demand from the UK surged over 400% due to shortages but remained modest at just over 10 000 tonnes. Imports also increased, with January volumes up 55.1% to 44 019 tonnes, largely from Belgium.
Record seed potato exports
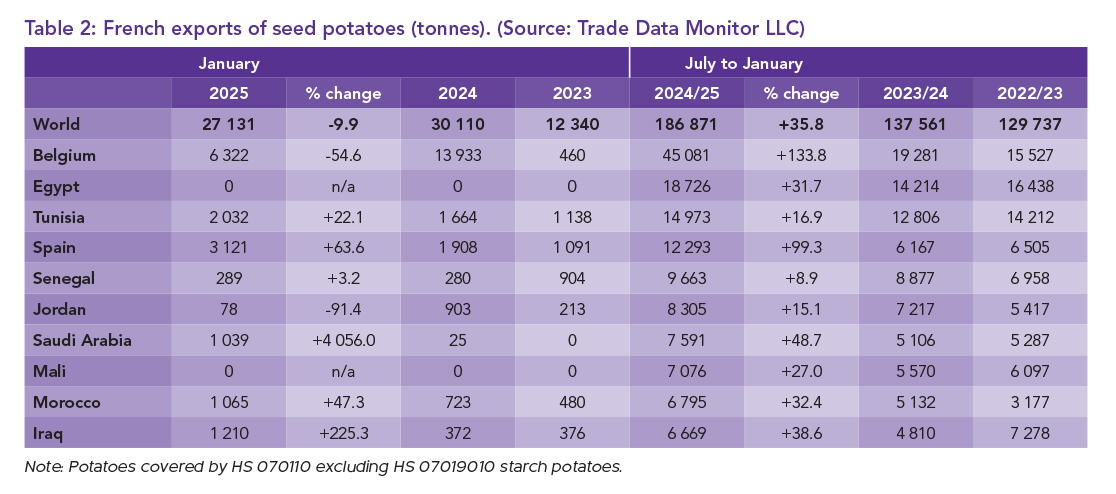
French seed potato exports jumped 35.8% to 186 871 tonnes, despite a 9.9% drop in January. The average price (€619/t) was almost unchanged from last year.
Belgium’s purchases more than doubled to 45 081 tonnes but fell 54.6% in January. Spain saw a 63.6% rise to 12 293 tonnes. Demand picked up in February and March as planting season approached.
March trade was unusually quiet, with prices varying widely based on quality. While premium potatoes remain in demand, weaker-quality stocks are abundant and struggling to find buyers.
Processing potato market weakness has affected fresh table potatoes. The benchmark Nord Basin Category I price fell €10/tonne last week to €470/tonne, €80 below last year’s level. Other Category I prices also dropped by €10/tonne, while Category II values remained stable.
Netherlands: A three-year low
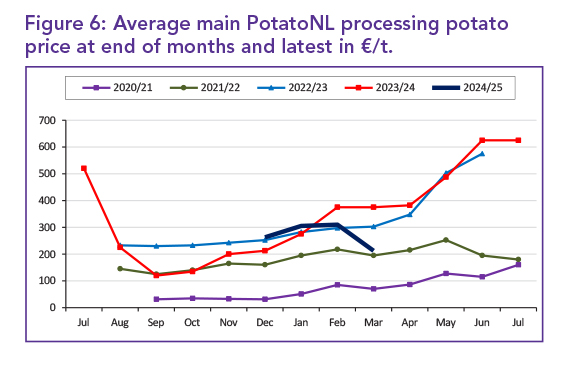
Dutch potato prices continued to decline, with the main Potato NL average falling to €212.50/t – a €20 drop. At the time of going to print, prices ranged from €175 to €250/t, €162.50 lower than this time last year and similar to March 2022 levels during the post-Covid recovery.
Prices are also now below contract rates. Some market prices fell as much as €32.50/t late in March. Lower-grade potatoes for flaking or livestock feed also saw price drops.
Although night temperatures were below freezing, warmer, sunnier days were being forecast with highs above 15°C. The cold could delay early potato growth once planting commences.
Belgium: Price decline on pause
After weeks of decline, Belgian processing potato prices stabilised and even inched up slightly. The Belgapom free-buy price for Fontane held steady at €175/t for the second consecutive week, though it was still €125/t lower than a month ago. This puts it €67/t below the average contract price, a gap that may widen as contract values rise.
Free-buy prices remained below the past three seasons’ March levels, although they were still €125/t higher than March 2021, when the market was hit hard by Covid-19 (Figure 7).
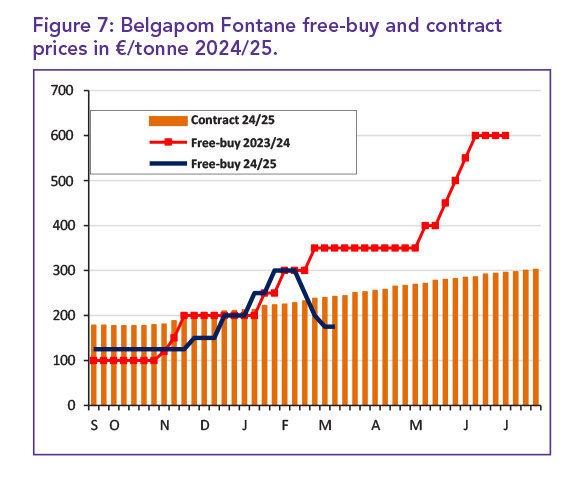
Price pressure continues due to declining quality, with more reports of fry defects, sprouting, or a need for washing in untreated stocks.
Rain disrupts Spanish season
Heavy rain across Spain has severely impacted the potato sector. In the south, especially Sevilla and Andalucia, excess moisture destroyed some fields and made crop treatments difficult. Companies such as Intersur and Patatas Melendez used drones to apply fungicides, but yields are expected to fall significantly. In the north, particularly Castilla y León, saturated land delayed planting by at least two weeks. Only limited planting started in areas such as Valladolid, while other regions remained on hold, awaiting drier conditions.
Ex-farm potato prices jumped 13.5% in early March to €545.30/t – 6% higher than the same week last year (Figure 8).
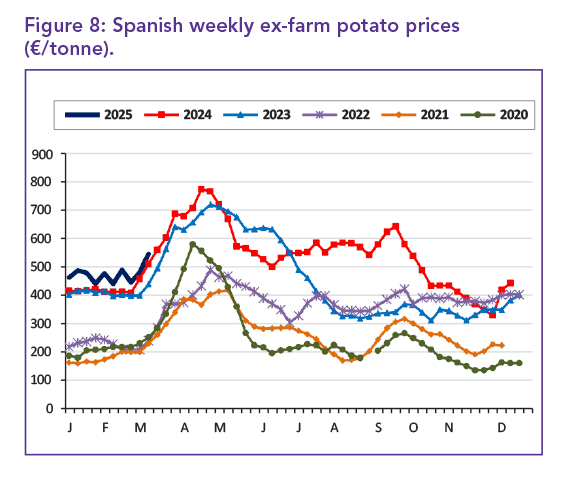
Prices are typically high this time of year, driven by limited supply from southern Spain’s summer crop and early imports from Israel and France. France remains Spain’s top potato supplier. Last year, Spanish imports of French potatoes rose 22% to 942 775 tonnes, accounting for 86% of total fruit and vegetable imports from France, and 70% of their value.
Portugal: Development at risk
Persistent rainfall across Portugal disrupted potato development and threatened yields. Despite a slight increase in the planted area, Manuel Janicas of Batatas Mirense expected output to decline due to adverse growing conditions.
As of mid-March, ware potatoes were priced at €350/t in Guarda and €400/t in Viseu, consistent with earlier weeks. New potatoes from Península de Setúbal fetched €450/t. Overall, the national average price of €350/t was 12.5% lower than the same time last year, and 20% below the average for the past three years.
Imports and exports
Ware potato imports surged by 18% in volume and 25% in value, reaching 413 471 tonnes, worth €152,1 million last year. Ware exports remained steady at 81 351 tonnes, with a 1% value increase to €39.9 million. Early potato imports jumped 26% to 17 293 tonnes, while exports nearly doubled to 1 088 tonnes.
Seed potato imports declined by 15% to 30 249 tonnes, but exports rose 14% to 4 111 tonnes, showing a shift in market dynamics. Price volatility is expected depending on how quickly weather conditions improve.
Canada: Strong February usage
Potato usage in Canada surged in February, reaching 513 000 tonnes, up 13% from last year, driven by fears of potential US trade tariffs.
Seasonal usage at the time totalled 2.95 million tonnes, the second highest on record. Stock levels in early March stood at 2.81 million tonnes, down 3.3% year-on-year.
Processed stocks were 1.93 million tonnes (-3.1%), fresh table stocks fell to a three-year low of 470 000 tonnes, and seed stocks dropped slightly to 407 000 tonnes (Figure 9).
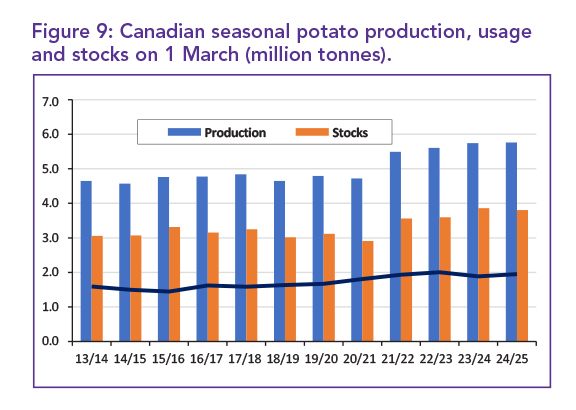
Regionally, the Maritimes saw a 14.4% increase in stocks, while the Prairies were down 15.2%, though still relatively high historically.
Saudi Arabia imports up
In December, Saudi Arabia imported 28 530 tonnes of frozen fries – the highest monthly volume since April and up 67.4% from a year ago (Figure 10).
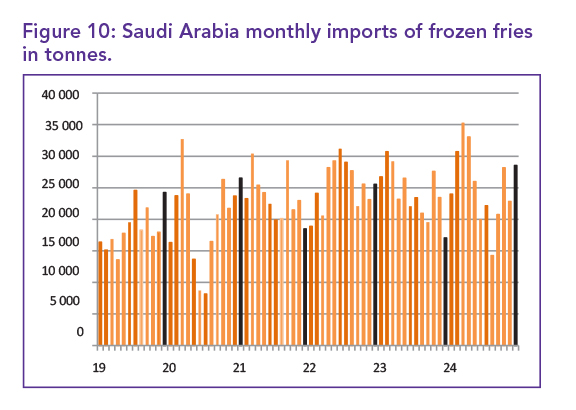
Dutch fries led imports at 8 954 tonnes, priced at €1 721/t (US$1 876), despite being €500 more expensive than Belgian fries (€1 209/t). Belgium and the Netherlands saw their combined market share fall from 75 to 66% over the year. Meanwhile, Egypt and France gained ground with lower-priced fries. India also surged, and China entered the market with 2 452 tonnes for the year.
Fresh potato imports are declining as Saudi Arabia pushes for self-sufficiency. Imports dropped 52% to 64 191 tonnes last year. Local production hit 621 000 tonnes, now covering 87% of domestic needs, supported by a rise in seed potato imports, mainly from the Netherlands, France, and the UK. In response to growing local supply, processing capacity is expanding.
India’s fry export growth slows
India’s frozen fry exports dipped 5.8% year-on-year in December last year, marking the first decline since April 2023 (Figure 11).
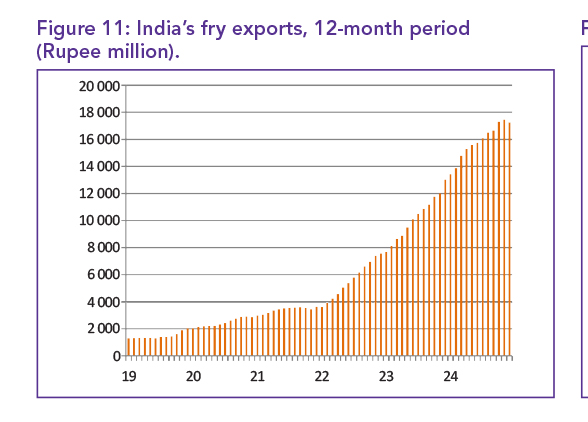
However, strong earlier sales drove annual exports up 48.6% to 172 444 tonnes, despite an 8.1% fall in average prices. Sales to top markets such as the Philippines and Thailand fell in December, but surging demand from Malaysia (+222%), Saudi Arabia (doubled), Indonesia, and the United Arab Emirates (UAE) offset losses. The industry continues to expand, with Belgium’s Agristo investing in a new processing plant in Uttar Pradesh.
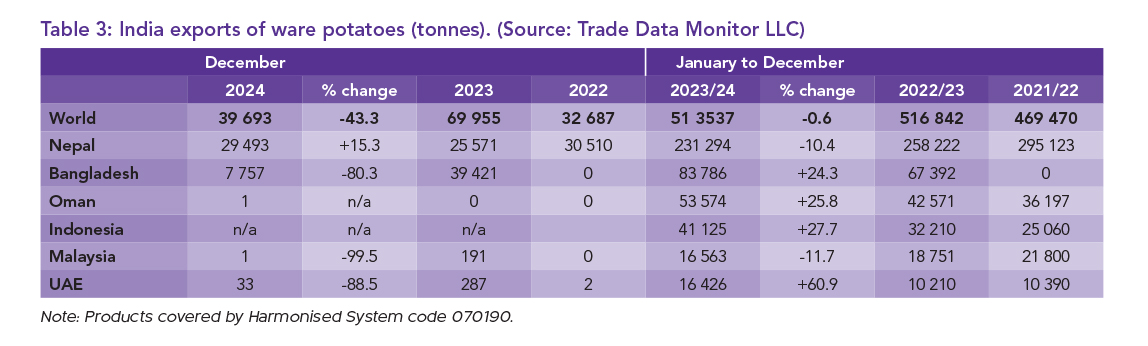
Ware potato exports fell 43.3% in December but ended last year nearly flat, only 0.6% lower year-on-year. Strong prices lifted export values to a record US$110 million. Nepal remained the largest buyer, though sales dropped 10.4%. Bangladesh saw a 24.3% increase in purchases last year, while exports to Oman earned more revenue despite lower volumes.
Record fry imports for Malaysia
In January, Malaysia’s fry imports hit a record 13 150 tonnes, with Dutch fries making a major comeback after the Netherlands slashed prices by 76%. Sales of Dutch fries surged from 1 200 tonnes in December last year to 5 303 tonnes in January, propelling the Netherlands back to being the second-largest annual importer, surpassing India.
The new Dutch import price was just MR 1 626/t (US$366), down from MR 6 900/t the previous month, reducing the average price to MR 4 938/t (US$1 111), 36.6% lower than last year. This price reduction is part of a diplomatic push to strengthen trade ties with Malaysia.
The US, the leading fry exporter to Malaysia, also saw increased sales, rising by 130.3% year-on-year to 2 681 tonnes, despite a smaller price cut of MR 656, bringing the price to MR 9 255/t (US$2 082).
Sales from China and other countries, including India and New Zealand, also grew. Chinese sales increased by 204 tonnes to 2 330 tonnes, with a slight price reduction, while India’s and New Zealand’s sales saw significant improvements compared to last year.
Belgium, however, lost market share, with its sales falling by more than a third to 519 tonnes, despite a 6.5% price drop.
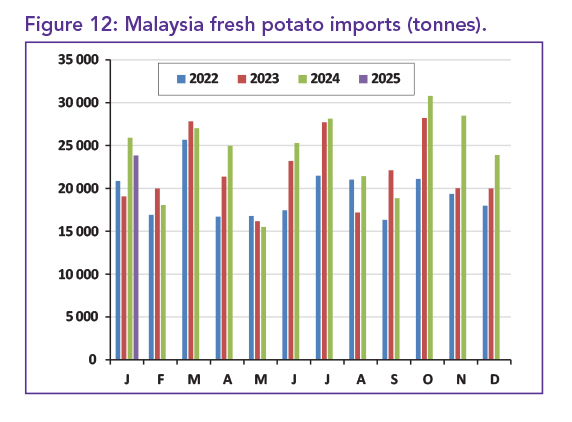
Malaysia’s total annual fry imports rose 15.5% to 98 833 tonnes in January, but remain 5.5% below the previous year’s consumption. The price reductions and boost in imports may stimulate continued demand, but future trends are uncertain. Fresh potato imports (Figure 12) held steady at 23 883 tonnes, with China supplying nearly 79% at MR 1 504/t (US$338), and Germany providing 2 573 tonnes at MR 2 272/t (US$511).
Australia performs well
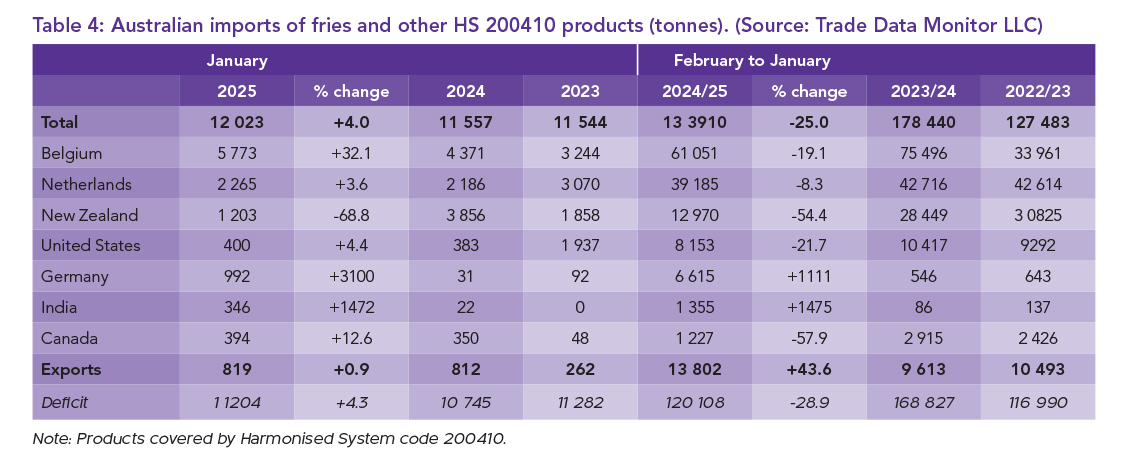
Imports of processed potato products in Australia rose by 4% in January to 12 023 tonnes, with a 16.6% increase in the total value, reaching A$25.684 million (US$16.35 million). New Zealand, despite seeing a 68.8% drop in sales compared to last year, still performed better than December, with a price increase of 57.3% to A$1 783/t (US$1 135). However, its sales were still down 68.8% on the year.
Belgium remained Australia’s largest supplier, providing 5 773 tonnes, a 32.1% increase from the previous year, though slightly down from December. Its price of A$2 283/t (US$1 453) was 9.3% lower than last year. The Netherlands, at A$1 983/t (US$1 262), had 2 265 tonnes of sales, up by 3.6% from the previous year, though their annual sales were down 8.3%.
Germany saw the most impressive growth, with a tenfold increase in annual sales to 6 615 tonnes, compared to just 31 tonnes last January. This surge was driven by a price drop to A$2 380/t (US$1 515). India also made gains, selling 1 355 tonnes annually, with January’s sales at 346 tonnes at a discounted price of A$596/t (US$379).
China’s sales of 377 tonnes were at A$1 806/t (US$1 149), while Canada’s sales were at A$1 831/t (US$1 165).
The Australian potato harvest finished in January, pushing exports of processed fries to 1 052 tonnes, a 29.5% increase from last year. Exports went mainly to New Zealand (819 tonnes) and the Philippines (211 tonnes).
Annual fry exports grew by 43.6%, with earnings up by 51.0%, totaling A$32.406 million (US$20.6 million).
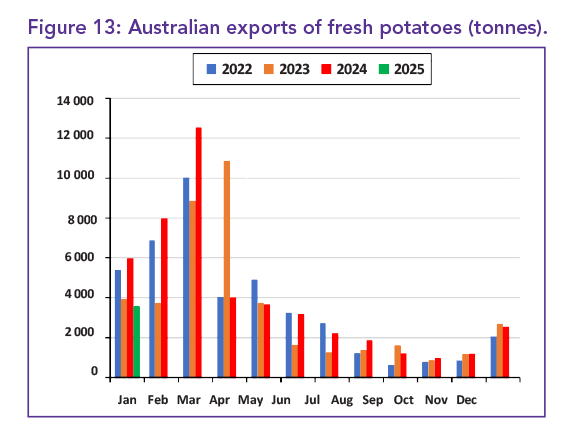
Exports of fresh potatoes for the year were up by 11.9%, reaching 44 592 tonnes, with earnings also increasing to A$46.805 million (US$29.79 million). The primary markets were South Korea, Taiwan, and the Philippines (Figure 13).
Trade figures explainer
Export and import values in world potato markets are typically calculated using different methods, depending on the country involved. The following breakdown clarifies how the value of goods is calculated for export and import transactions across different regions:
- Export figures (non-US): Calculated on a free on board (FOB) basis. This means the value includes all costs associated with the delivery of goods from the manufacturer to the port, but excludes freight, insurance, and any fees after the goods leave the port.
- US export figures: Calculated on a free alongside ship (FAS) basis. This value includes costs for insurance, inland delivery, and any other charges up to the point when the goods reach the port, but excludes loading, freight, and other costs incurred after the goods are loaded onto the ship.
- Imports (most countries): Calculated on a cost, insurance, and freight (CIF) basis. This means the value of goods includes the cost of the merchandise, along with insurance and freight charges upon reaching the port of import.
- Australian and US imports: Calculated on a custom import value (CV) basis, excluding fees such as freight, inland transportation, insurance, and duties.
- Specific countries.
- Bolivia, Brazil, Canada, Iceland, Mauritius, Mexico, Philippines, Senegal, South Africa: Imports are calculated on a FOB basis.
- New Zealand: Imports are calculated on a value for duty (VFD) basis, similar to FOB, excluding insurance and freight. – Ané du Plessis, Potatoes SA
For more information, send an email to ane@potatoes.co.za, visit www.potatoes.co.za, or visit www.indianpotato.com (India-specific).